The Screening Activity: SECA (Universal Screening) dashboard displays de-identified, aggregated, real-time data information from all SECA (Universal Screening) forms completed for participants.
The forms included are dependent on which versions are assigned to your organization and have at least one completed screen.
The dashboard only displays information about screens that have been finalized and does not include forms that have not been started or are still in progress.
The screening date is based on when the task was completed, not the date the task was originally assigned.
For general information on navigating dashboards, please click this link.
Dropdown/Selectable Filters:
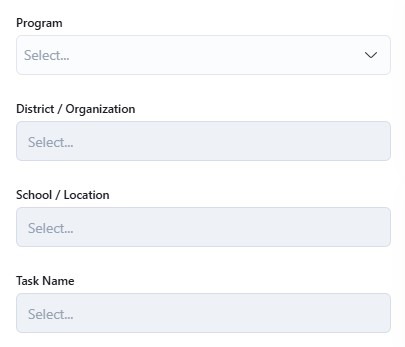
You can use the dropdown/selectable filter options to narrow the dashboard results to only show specific programs, districts/organizations, schools/locations, and/or task name (if there are different versions of the form used). Otherwise, the default view will show all of the forms completed across all participating programs and locations
Program
District / Organization
School / Location
Task Name (For different versions of the form)
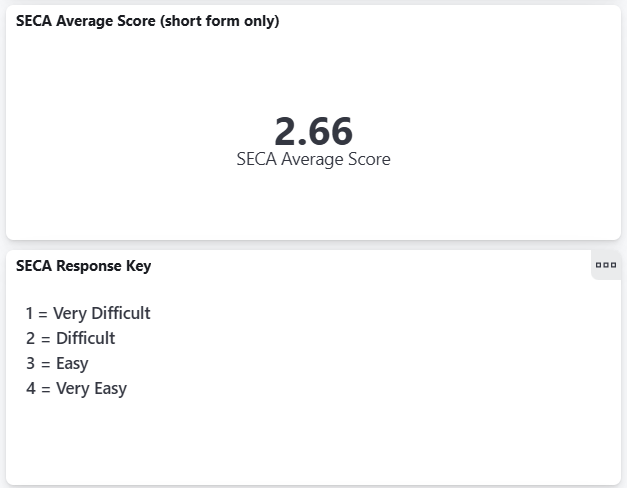
The Screening Activity: SECA (Universal Screening) dashboard is an easy way to pull the following value:
SECA Average Score (short form only)
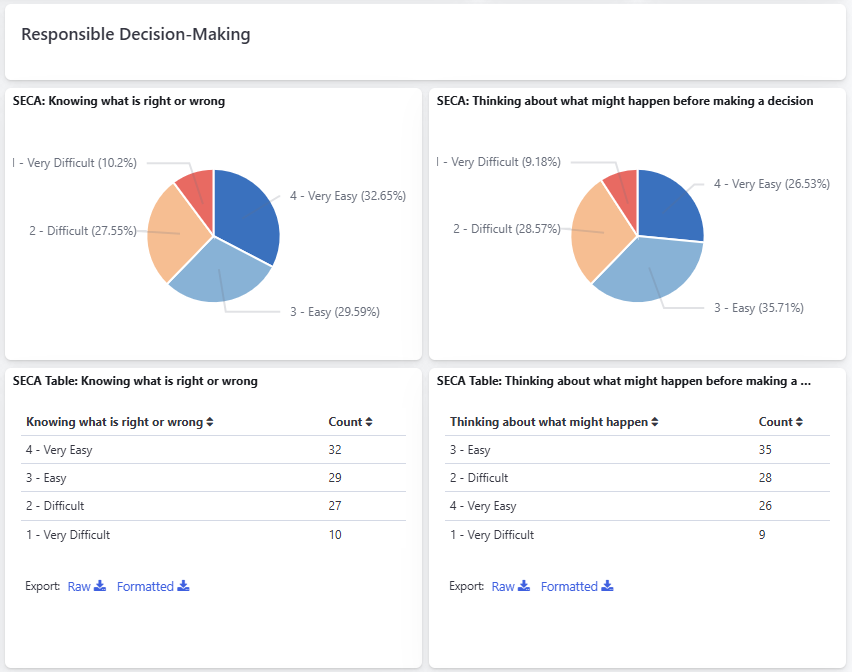
The Screening Activity: SECA (Universal Screening) dashboard also includes the following charts and tables:
Percentage of responses and Total Counts for the following questions over the selected Time Frame
Self-Awareness: Self-Concept
Knowing what my strengths are
Responsible Decision-Making
Knowing what is right or wrong
Thinking about what might happen before making a decision
Self-Awareness: Emotion Knowledge
Knowing when my feelings are making it hard for me to focus
Knowing ways I calm myself down
Knowing the emotions I feel
Social Awareness
Knowing what people may be feeling by the look on their face
Knowing when someone needs help
Learning from people with different opinions than me
Self-Management: Emotion Regulation
Getting through something even when I feel frustrated
Being patient even when I am really excited
Self-Management: Goal Management
Finishing tasks even if they are hard for me
Setting goals for myself
Self-Management: Schoolwork
Doing my schoolwork even when I do not feel like it
Being prepared for tests
Relationship Skills
Respecting a classmate’s opinions during a disagreement
Getting along with my classmates
Trends Over Time for the following Domains, comparing the average scores from the Beginning of Year, Middle of Year, and End of Year (Bar Graphs)
Self Concept
Decision-Making
Emotional Knowledge
Emotional Regulation
Social Awareness
Schoolwork
Goal Management
Relationship Skills
If you do not see data in the Average Scores by Task Name / Time Period visual, please contact Customer Support https://mdlogix.freshdesk.com/support/tickets/new to configure this for your organization.
Resetting the Dashboard
To clear individual filters, please click the X next to the filter at the top of the dashboard
To reset the dashboard to its original settings, click the Refresh button on your browser

Download to PDF
Once you have defined the dashboard based on your needs, you can export the entire dashboard as a PDF using the Download to PDF button found on the upper right-hand side.

Was this article helpful?
That’s Great!
Thank you for your feedback
Sorry! We couldn't be helpful
Thank you for your feedback
Feedback sent
We appreciate your effort and will try to fix the article