The Screening Activity: CAGE-AID dashboard displays de-identified, aggregated, real-time data information from all CAGE-AID forms completed for participants.
The forms included are dependent on which versions are assigned to your organization and have at least one completed screen.
The dashboard only displays information about screens that have been finalized and does not include forms that have not been started or are still in progress.
The screening date is based on when the task was completed, not the date the task was originally assigned.
For general information on navigating dashboards, please click this link.
Dropdown/Selectable Filters:
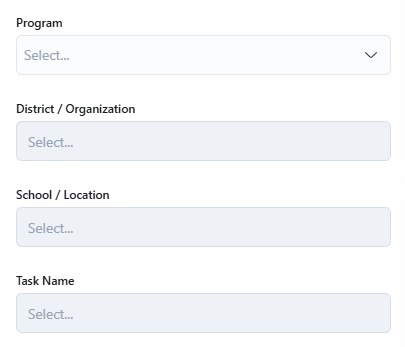
You can use the dropdown/selectable filter options to narrow the dashboard results to only show specific programs, districts/organizations, schools/locations, and/or task name (if there are different versions of the form used). Otherwise, the default view will show all of the forms completed across all participating programs and locations
Program
District / Organization
School / Location
Task Name (For different versions of the form)
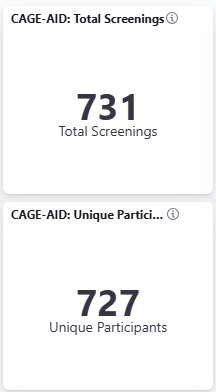
The Screening Activity: CAGE-AID dashboard is an easy way to pull the following numbers:
Total number of screenings
Total number of unique participants with at least one completed screen
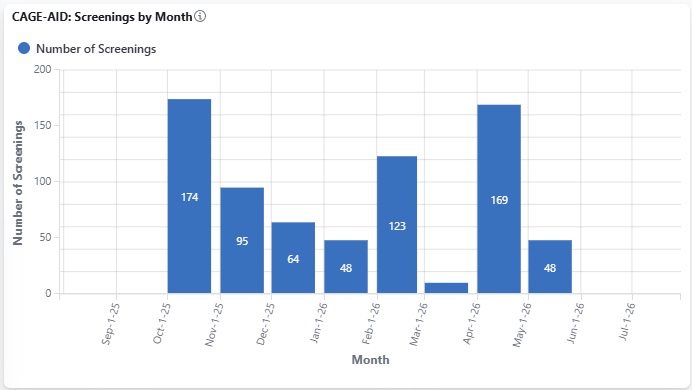
The Screening Activity: CAGE-AID dashboard also includes the following charts and tables:
Screenings by Month
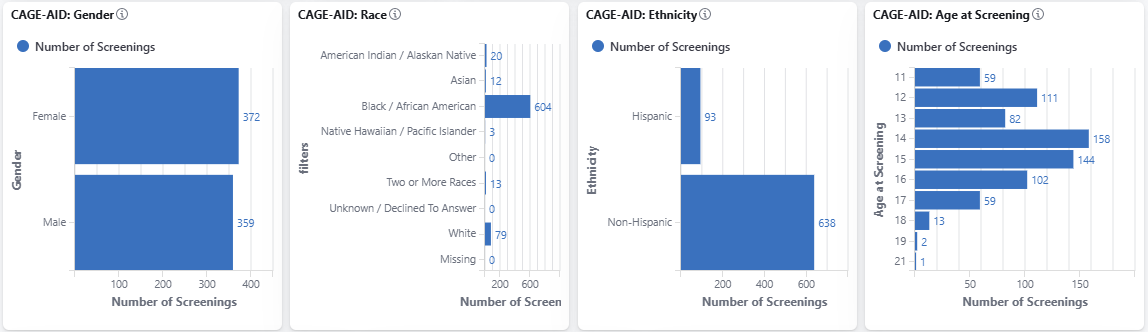
Demographics of the participants who have at least one CAGE-AID completed:
Gender
Race
Ethnicity
Age at Screening
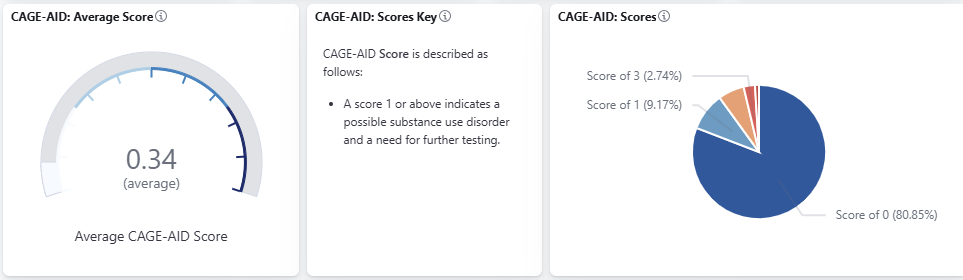
Average Score for the selected Time Frame
Percentage of each score reported
Pie Charts with breakdowns of answers for the following questions
Have you ever felt you ought to cut down on your drinking or drug use?
Have people annoyed you by criticizing your drinking or drug use?
Have you felt bad or guilty about your drinking or drug use?
Have you ever had a drink or used drugs first thing in the morning to steady your nerves or to get rid of a hangover (eye-opener)?

Resetting the Dashboard
To clear individual filters, please click the X next to the filter at the top of the dashboard
To reset the dashboard to its original settings, click the Refresh button on your browser

Download to PDF
Once you have defined the dashboard based on your needs, you can export the entire dashboard as a PDF using the Download to PDF button found on the upper right-hand side.

Was this article helpful?
That’s Great!
Thank you for your feedback
Sorry! We couldn't be helpful
Thank you for your feedback
Feedback sent
We appreciate your effort and will try to fix the article